Scenario Modeling

Run the scenario before the market moves.

Argonyx Capital Holdings sale scenario
Thought process
Ran 2 commands, read a file
Used 5 tools, loaded tools
Used 3 tools
Create scenario
Result
Run scenario
Result
Get scenario run results
Result
Done — scenario built and run. Here's Argonyx exiting two quarters late (Q1 2027 → Q3 2027) vs. Base:
MetricBaseArgonyx Q3 2027Delta
Gross IRR27.33%27.20%−14 bps
Net IRR20.64%19.13%−151 bps
Total distributions$1,376.9M$1,377.1M+$0.2M
Total carry$233.6M$306.0M+$72.4M
Net management fees$83.36M$83.63M+$0.27M

Pushing the exit out two quarters delays the same proceeds, so IRR slips — and net IRR drops more than gross (~151 bps vs ~14) because the extra two quarters of fund life accrue more management fees and carry against the LPs. Distributions are essentially flat (same dollars, later), while projected carry jumps ~$72M — the main driver of the net-IRR drag.

The scenario "Argonyx exit Q3 2027 (2 quarters late)" and its run are saved and viewable in the Scenario Modeling UI. Want me to break down the quarterly cashflow timing to show exactly where the shift lands?

Progress
5 of 5
Working folder
Scratchpad
Context
+
Track tools and referenced files used in this task.
AI-Native Modeling

Connect reliable, deterministic modeling logic to your AI tool of choice via the Maybern MCP
app.maybern.com/scenario-modeling
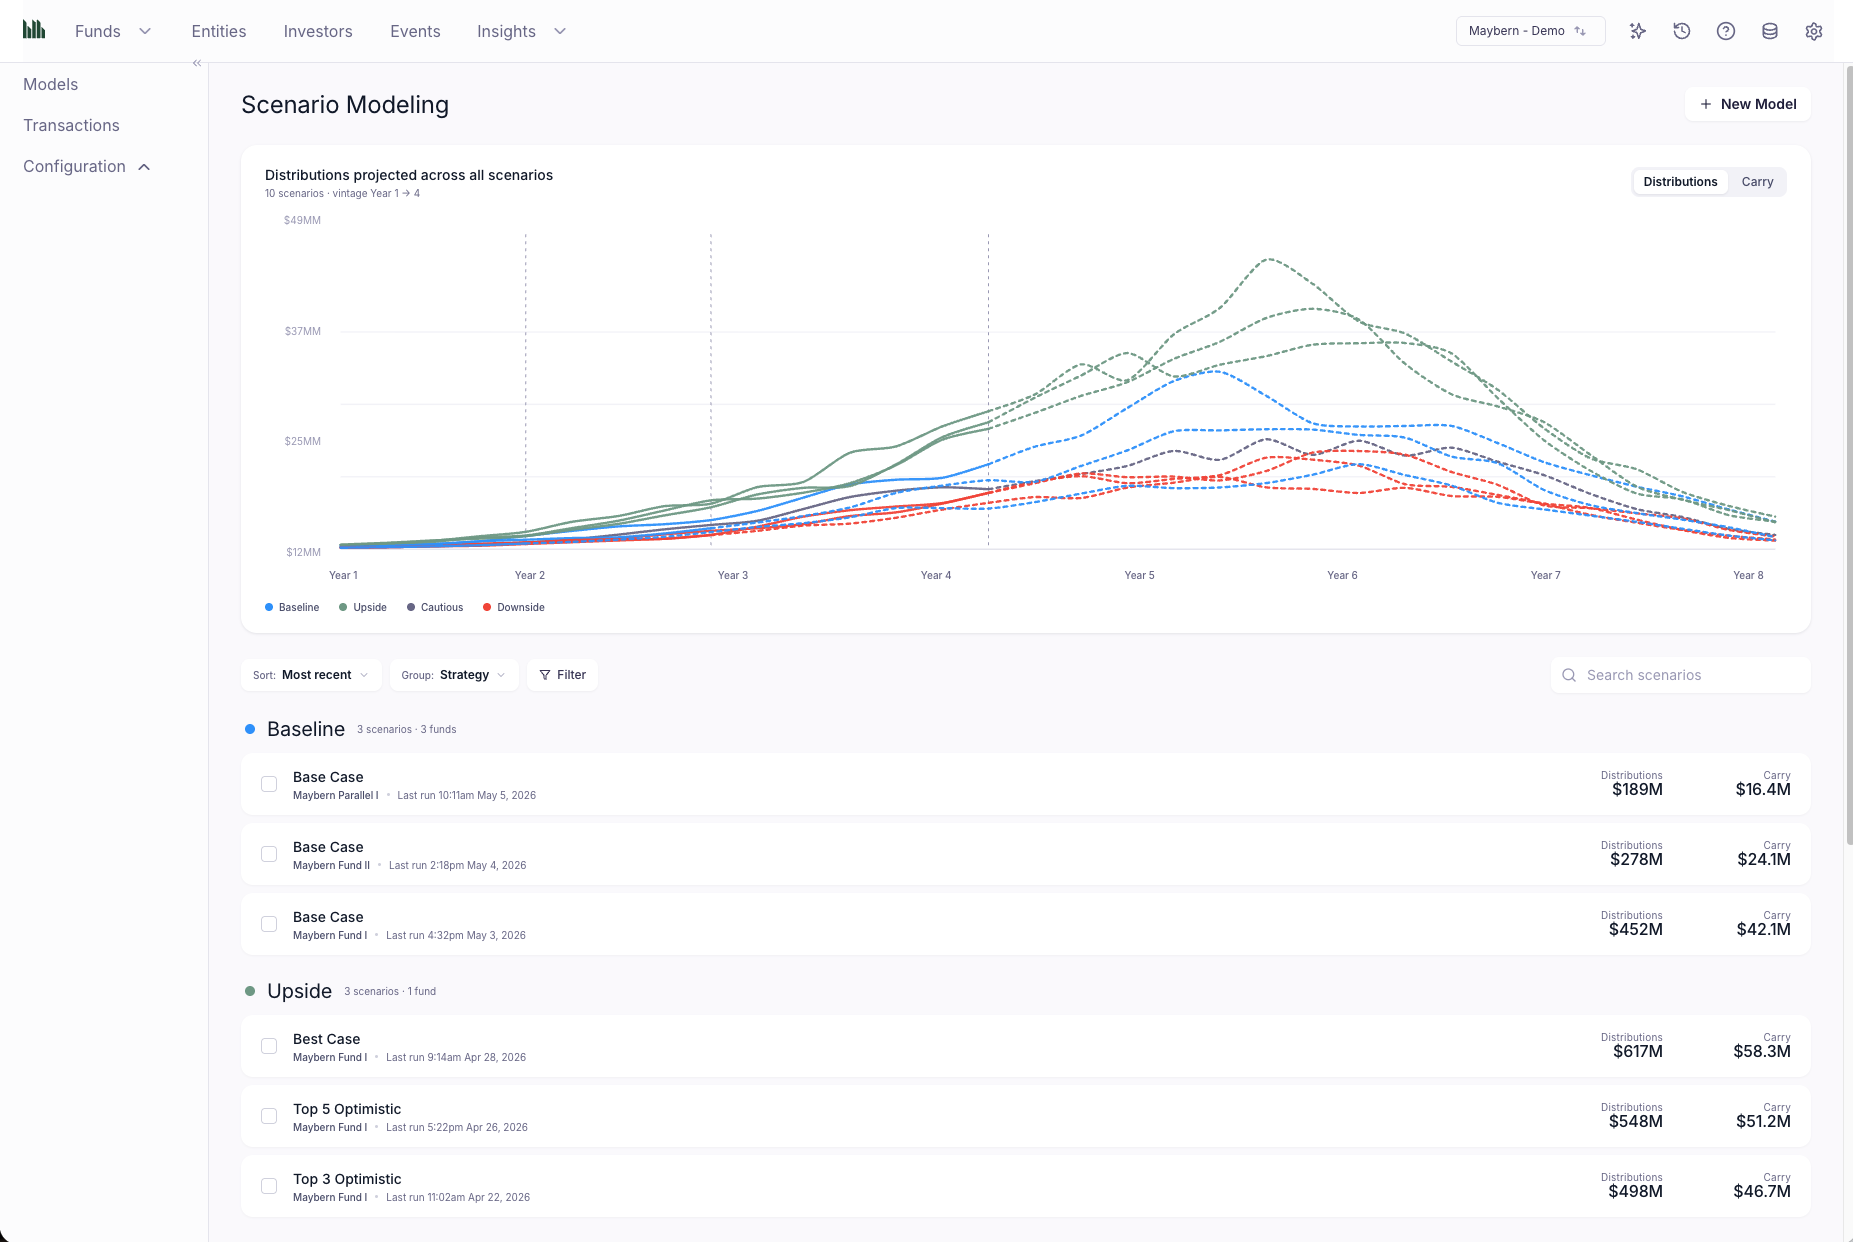
Scenario Modeling

Every run lands in one place — projections and actuals in the same system of record.
app.maybern.com/scenario-modeling
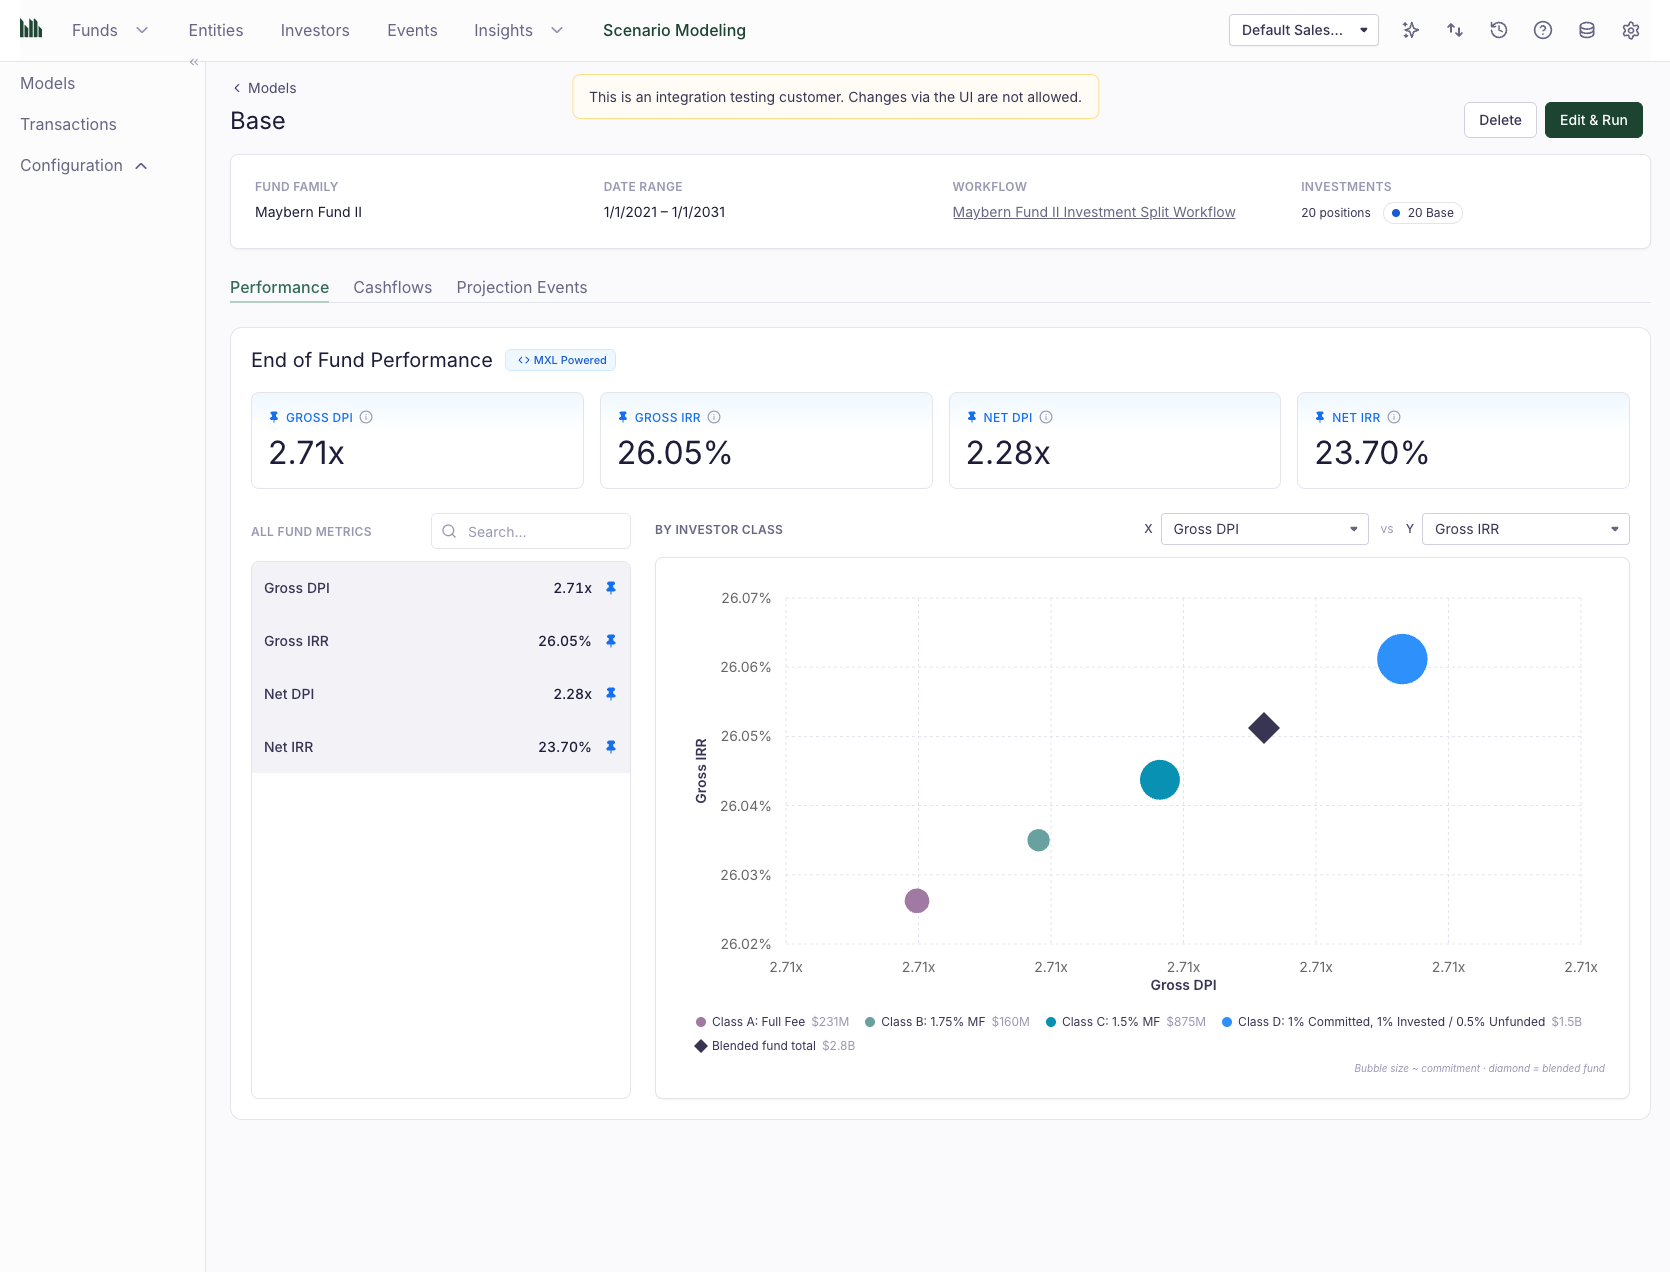
MXL Performance Metrics

Projected metrics, calculated with the exact same methodology as your actuals. No methodology drift.
app.maybern.com/scenario-modeling
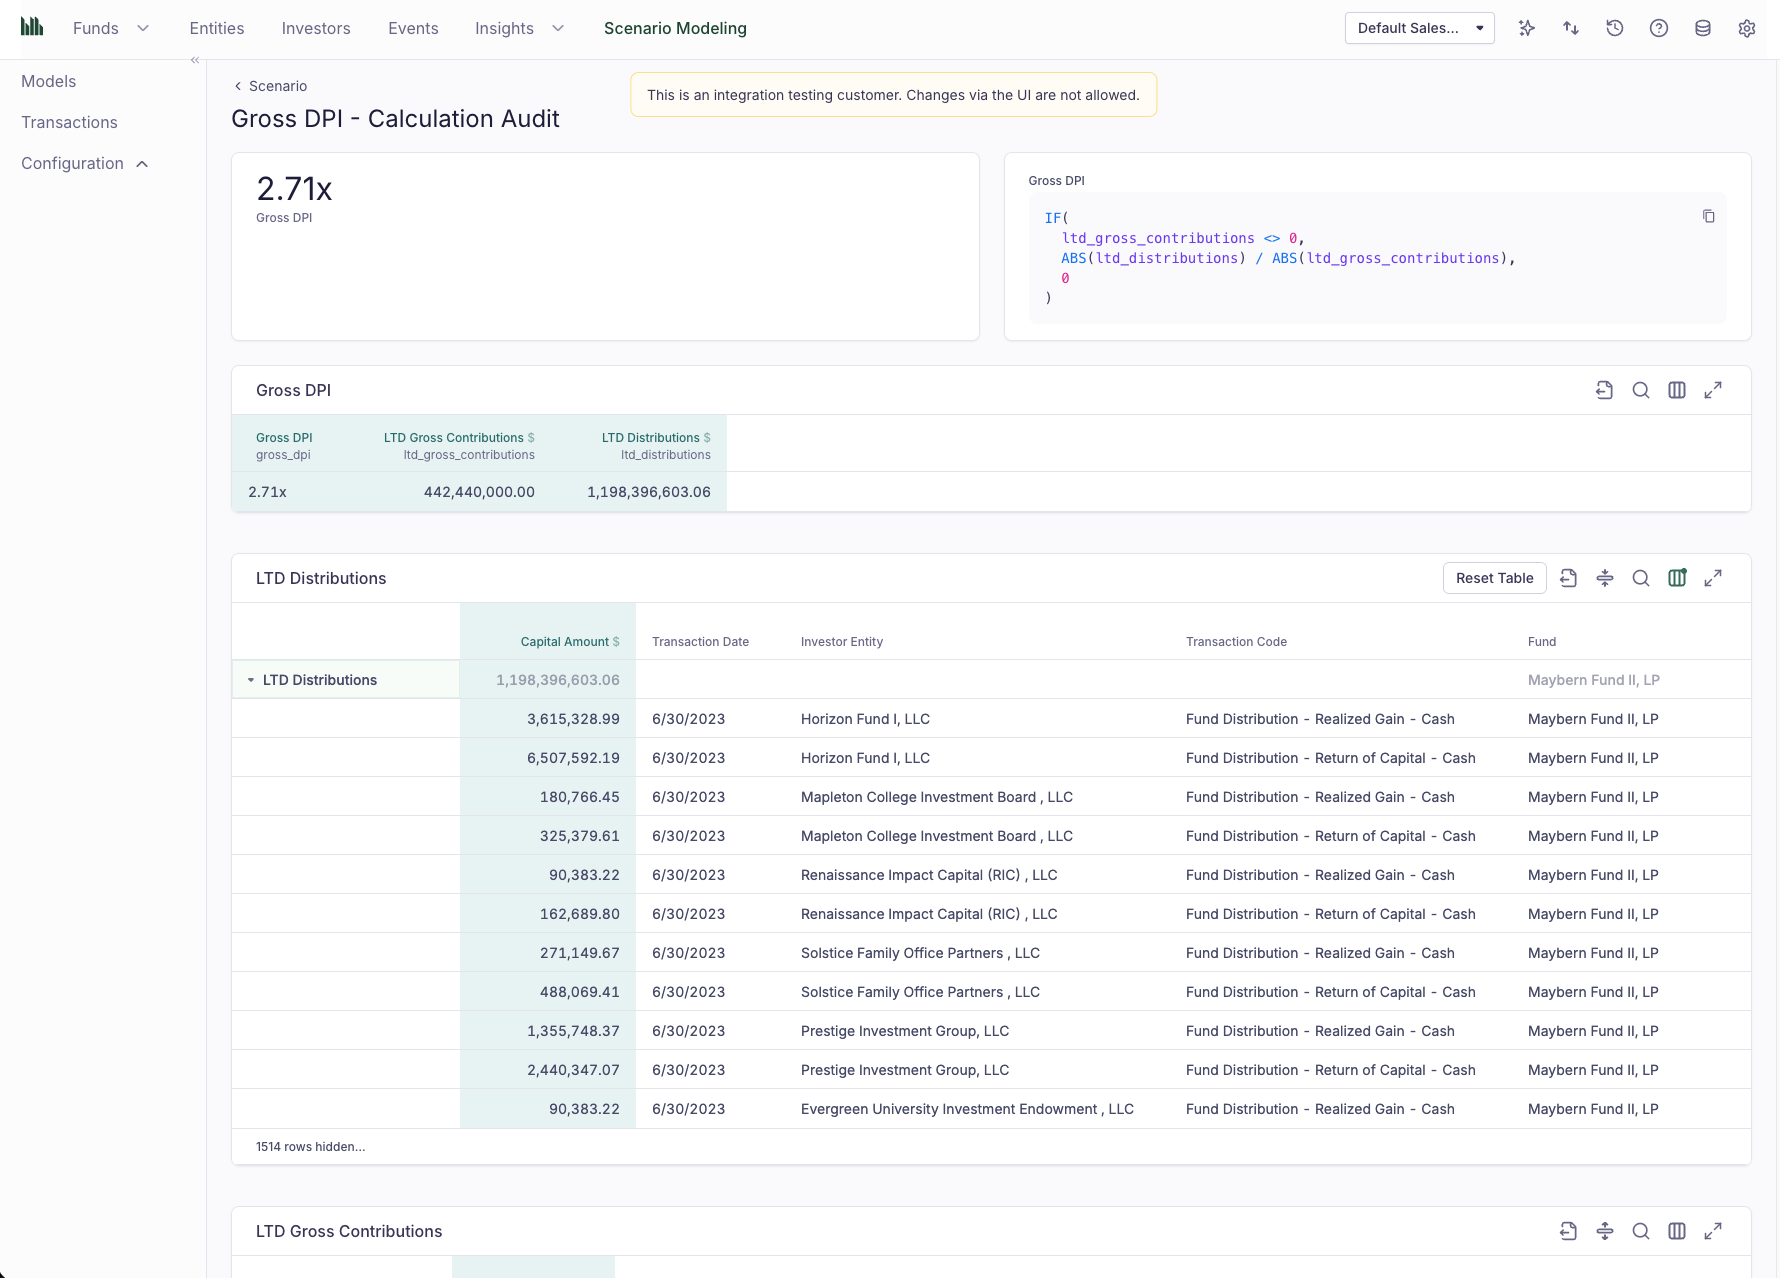
Full Audit Trail

Every projected number traces to source — inputs, formulas, and every cashflow behind it. When an LP asks where this came from, you have the answer.
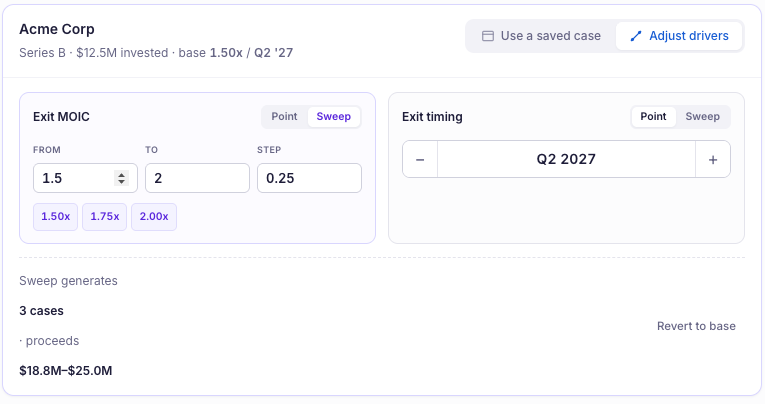
Deal Driver Sweep

Toggle deal drivers — exit timing, exit multiple — and sweep tens of scenarios at once.

app.maybern.com/scenario-modeling/compare
Scenario Comparison

Compare every scenario side by side. See which variables move your returns the most.

Yesterday's funds react to the numbers.
Tomorrow's funds run scenarios before the market moves.

Argonyx Capital Holdings sale scenario
Create scenarioResult
Run scenarioResult
Get scenario run resultsResult
Done — scenario built and run. Here's Argonyx exiting two quarters late vs. Base:
AI-Native Modeling

Connect deterministic modeling logic to your AI tool of choice via the Maybern MCP

Argonyx exit Q3 2027 — vs. Base
MetricBaseQ3 2027Delta
Gross IRR27.33%27.20%−14 bps
Net IRR20.64%19.13%−151 bps
Distributions$1,376.9M$1,377.1M+$0.2M
Total carry$233.6M$306.0M+$72.4M
Mgmt. fees$83.36M$83.63M+$0.27M
Scenario Modeling

Every run lands in one place — projections and actuals in the same system of record.

app.maybern.com/scenario-modeling
MXL Performance Metrics

Projected metrics, calculated with the exact same methodology as your actuals.

Maybern

Yesterday's funds react to the numbers.
Tomorrow's funds run scenarios before the market moves.

When scenarios are cheap to run, your team runs the analysis in the room.

Argonix

Series B · $12.5M invested · base 1.50x / Q2 '27
Adjust drivers
Exit MOIC
PointSweep
From
1.5
To
2
Step
0.25
1.50x1.75x2.00x
Exit timing
PointSweep
Q2 2027+
Sweep generates3 cases
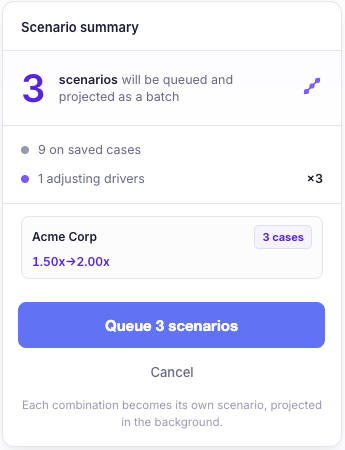
Scenario summary
3scenarios will be queued and projected as a batch
9 on saved cases
1 adjusting drivers×3
Argonix3 cases
1.50x→2.00x
Queue 3 scenarios
Cancel
Each combination becomes its own scenario, projected in the background.
  • Change one assumption and re-run in seconds: push every exit date back a year, toggle a range of exit MOICs for a single deal, restructure a fee.
  • Run sensitivity analysis to see which drivers move your returns the most.
  • Create unlimited cases at the deal level, combine them to see fund-level impact instantly.

Your projections and actuals, on the same rails. No reconciliation needed.

Argonyx Capital Holdings sale scenario
run a scenario in Maybern where we sell Argonyx two quarters early
Thought process
Ran commands, used 8 tools
Create scenario
Result
Run scenario
Result
Get scenario run results
Result
Done — scenario built and run. Here's Argonyx exiting two quarters late (Q1 2027 → Q3 2027) vs. Base:
MetricBaseArgonyx Q3 2027Delta
Gross IRR27.33%27.20%−14 bps
Net IRR20.64%19.13%−151 bps
Total distributions$1,376.9M$1,377.1M+$0.2M
Total carry$233.6M$306.0M+$72.4M
Net management fees$83.36M$83.63M+$0.27M

Pushing the $60M exit out two quarters delays the same proceeds, so IRR slips — and the net IRR drops more than gross (~151 bps vs ~14) because the extra two quarters of fund life accrue more management fees and carry against the LPs. Distributions are essentially flat (same dollars, later), while projected carry jumps ~$72M, the main driver of the net-IRR drag.

The scenario "Argonyx exit Q3 2027 (2 quarters late)" and its run are saved and viewable in the Scenario Modeling UI. Want me to also break down the quarterly cashflow timing on Argonyx to show exactly where the shift lands?

Progress5 of 5
Working folder
Scratchpad
Context
+
Track tools and referenced files used in this task.
  • Empower AI agents to reliably adjust assumptions, spin up scenarios, and create LP-facing materials. Results are saved in Maybern for further analysis.
  • Projected IRR, DPI, TVPI, NAV, carry, and AMF at the investment, fund, and LP level, calculated on Maybern’s deterministic rails.
  • Every projected number traces back to the inputs and formulas that produced it.

What used to take days runs while the question is still on the table.

Net IRR across all scenarios

4 scenarios · Maybern Fund I · — actuals, - - - projected
DistributionsDPICarryNet IRR
0.0%5.0%10.0%15.0%20.0%25.0%30.0%35.0% 2024202520262027202820292030 Year Today
Actuals (all scenarios) Base Case Argonix 2.5x MOIC Argonix 1.75x MOIC Argonix 1.5x MOIC
Metric Base CaseAnchor Argonix 2.5x
MOIC
Argonix 1.75x
MOIC
Argonix 1.5x
MOIC
ReturnsNet IRR18.4%22.9%+4.5 pp12.3%−6.1 pp9.1%−9.3 pp
Gross IRR22.7%27.4%+4.7 pp15.8%−6.9 pp12.4%−10.3 pp
TVPI2.05×2.62×+0.57×1.71×−0.34×1.51×−0.54×
DPI1.05×1.30×+0.25×0.78×−0.27×0.62×−0.43×
Net MOIC1.95×2.42×+0.47×1.62×−0.33×1.42×−0.53×
EconomicsDistributions$452M$617M+$165M$332M−$120M$248M−$204M
Total Carry$42.1M$58.3M+$16.2M$22.4M−$19.7M$14.2M−$27.9M
Mgmt. Fee$145.2M$145.2M0.00$145.2M0.00$145.2M0.00
TimingFirst Carry PaymentQ2 '28Q1 '28−1 qtrsQ3 '28+1 qtrs
  • Instantly view cross-fund projections, at the fund or LP level.
  • Compare scenarios side by side, without any rebuild.
  • When an LP asks how a delay hits their returns, show them before the call ends.
  • Deal projection - Toggle key deal assumptions to create new deal projection cashflows. Bulk upload new cases of deal projections via CSV or MCP.
  • Visual workflow builder - Define capital call timing, distributions, fee calculations, and waterfall logic visually.
  • Full transaction history with audit trail - Every projected capital call, distribution, and fee charge is a traceable transaction.

Yesterday's funds react to the numbers.
Tomorrow's funds run scenarios before the market moves.

Our team will walk you through how we provide instant insights into drivers of the metrics that matter most – projected IRRs, carried interest, management fees and distributions.

Thanks. A fund finance expert from Maybern will be in touch.
Oops! Something went wrong while submitting the form.
From Complexity to Clarity: Empower the Modern Fund Finance Team
Request a Demo
->